Best AI Coding Tools for Debugging in 2026
Writing new code and fixing broken code call for different strengths — a bug needs to be found, understood, and traced back to its actual cause, not just patched until the symptom disappears. Here's a look at AI tools specifically worth reaching for during debugging, alongside a closer companion piece on this site covering a slightly different set of tools if you want a second opinion.
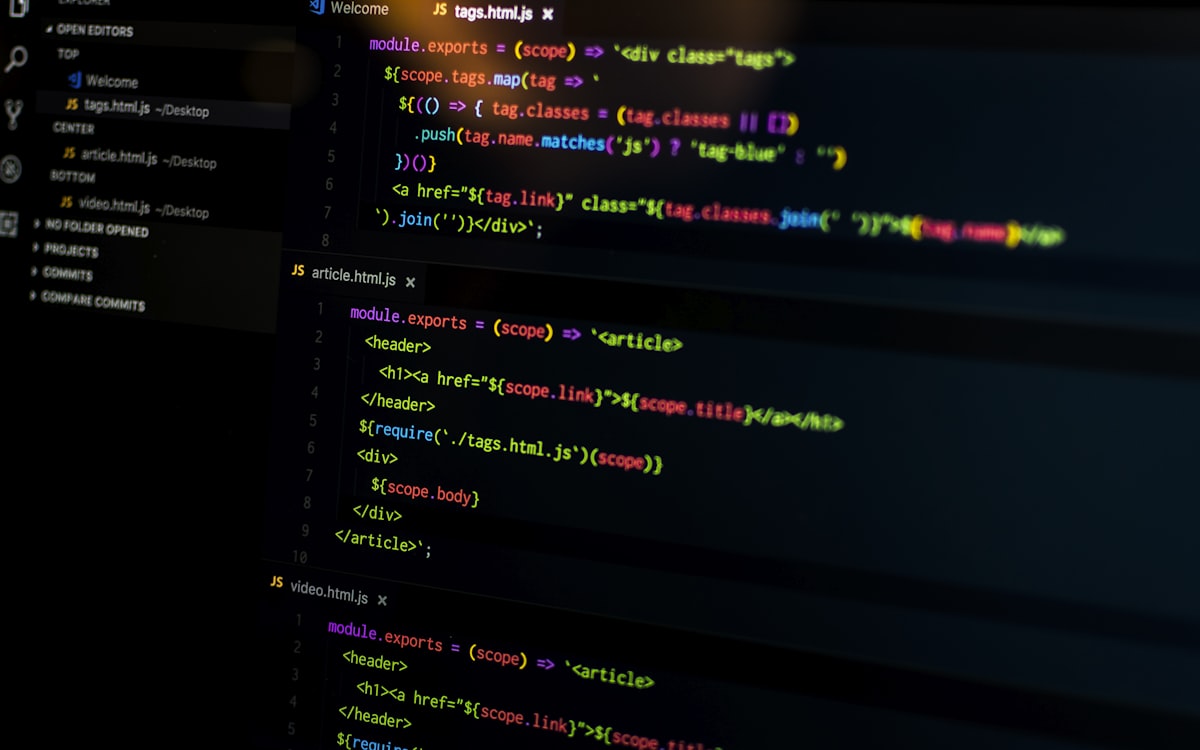
A good AI debugging tool explains the likely root cause, not just a patch that makes the error message disappear.
The Difference Between Fixing and Patching
An AI tool can often make an error message go away without actually fixing the underlying problem — silencing a warning, adding a defensive check that masks a deeper issue rather than resolving it. The tools worth using for debugging specifically are the ones that explain why a bug happened, not just what change makes the symptom disappear. That distinction is worth checking for explicitly, regardless of which tool you use: ask it to explain the root cause before accepting a fix.
If you've already read our companion piece on AI tools for debugging code, this list leans toward a slightly different set of options and use cases — worth reading both if debugging AI assistance is a priority for your workflow.
5 AI Tools Worth Using for Debugging
Claude Code
Well suited to a bug that spans multiple files or requires tracing a value's path through several layers of a codebase, since it can autonomously read across a project rather than requiring you to manually gather all the relevant context yourself.
Cursor's Chat Panel
A fast way to get a second opinion on a specific error — paste a stack trace and the relevant function, and ask targeted follow-up questions about what's actually going wrong, staying inside the same editor where the bug lives.
Sentry Seer
Built directly into Sentry's existing error-monitoring platform, so it works from real production error data and stack traces you're already collecting, rather than requiring you to reproduce and describe a bug from scratch.
GitHub Copilot Chat
Useful for a quick, in-editor explanation of an error message or an unfamiliar exception type, especially when you just need a plain-language translation of what a cryptic error actually means.
ChatGPT or Claude (plain chat)
For an especially tricky or unusual bug, a plain chat interface with a longer back-and-forth conversation sometimes surfaces a root cause faster than an inline tool, simply because you can explain more context and reasoning than a code editor's chat panel comfortably fits.
Always Ask "Why," Not Just "Fix It"
Ask for the Root Cause First
Before accepting a suggested fix, ask the tool to explain why the bug is happening, not just what change resolves it.
Watch for Suppressed Symptoms
Be suspicious of a fix that adds a try/catch or a null check without explaining why the value was unexpected in the first place.
Use Production Data When You Have It
A tool like Sentry Seer that works from real error data tends to diagnose faster than describing a bug from memory.
Cross-Check on a Hard Bug
For a genuinely confusing bug, getting a second opinion from a different tool or a plain chat conversation can surface an angle one tool missed.
Bottom Line
Claude Code and Cursor both handle the common case well — a bug that needs some cross-file context to understand. Sentry Seer is worth adding specifically if you already use Sentry for error monitoring, since it works from real production data rather than a bug you have to manually describe. Whichever tool you use, the habit that actually matters is asking for the root cause before accepting any fix.
What Debugging With AI Actually Looks Like Step by Step
Consider a backend endpoint that intermittently returns the wrong data under load. Pasting the error alone into a chat tool often produces a superficial fix — adding a null check, say — without addressing why the data was wrong in the first place. A more effective approach is providing the tool with the relevant function, the surrounding code that calls it, and the specific conditions under which the bug appears, then explicitly asking it to reason through the likely root cause before suggesting any change.
This is where a tool like Claude Code's ability to read across multiple files matters in practice: it can trace how a value flows from a database query through several intermediate functions to the point where it's used incorrectly, rather than only seeing the isolated function where the symptom finally shows up. A narrower, single-file chat tool can still get there, but usually needs the developer to manually gather and paste in that broader context first.
The Short Version, All in One Place
To recap: Claude Code and Cursor both handle the common debugging case well — a bug that needs some cross-file context to trace properly. Sentry Seer is worth adding if you already use Sentry, since it works from real production error data rather than a bug you have to reproduce manually. GitHub Copilot Chat and plain chat tools like Claude or ChatGPT are useful for quick explanations or a fresh perspective on a particularly tricky bug. Across all of them, the habit that matters most is asking for the root cause before accepting any suggested fix, rather than accepting whatever makes the error message disappear fastest.
More AI Guides, Written Clearly
Browse our full library of AI tool guides, updated regularly as models and features change.
Common Questions
What's the best AI tool for debugging a multi-file codebase?
Claude Code tends to handle this well, since it can autonomously trace a value or an error across several files rather than requiring you to manually gather all the relevant context first.
Is there an AI debugging tool that works with production error data?
Yes. Sentry Seer is built into Sentry's existing error-monitoring platform, so it can work directly from real production stack traces rather than a bug you have to reproduce and describe from scratch.
How is this list different from your other AI debugging tools article?
This piece leans toward a slightly different set of tools and use cases, including chat-based approaches and Sentry's production-data-driven option; reading both gives a more complete picture if debugging assistance is a priority.
How do I avoid an AI tool just masking a bug instead of fixing it?
Ask the tool to explain the root cause of the error before accepting any suggested fix, and be cautious of fixes that add a defensive check or suppress a warning without explaining why the underlying value was unexpected.
Should I paste my whole codebase into an AI tool to debug one issue?
Usually not necessary — providing the specific function, its immediate callers, and a description of when the bug occurs is typically enough context, especially with a tool like Claude Code that can pull in more surrounding code on its own when needed.
Can AI tools debug issues that only happen intermittently or under specific conditions?
They can help reason through likely causes, but intermittent or load-dependent bugs are still often the hardest category to fully resolve with AI assistance alone, since the tool can't directly observe production conditions the way a monitoring system like Sentry can.
Can AI tools debug issues in compiled languages as well as interpreted ones?
The general debugging approach — providing context and asking for root-cause reasoning — applies to compiled languages too, though tools like Claude Code and Cursor were more heavily used and tested with popular interpreted languages like Python and JavaScript.
Is Sentry Seer only useful for teams already using Sentry?
Yes, its main advantage is working directly from Sentry's existing error-monitoring data, so its value is tied to already having Sentry integrated into your error tracking; a team without Sentry would need to reproduce and describe bugs manually as with other tools.
More from the creator
Explore two other projects from the same creator.